Operational Results
Financial market
The activities of the GPW Group on the financial market include:
- trade in financial instruments on the regulated market and in the alternative trading system:
- trade in shares and other equity instruments on the Main Market and on the NewConnect market,
- trade in derivatives on the Main Market,
- trade in debt instruments on the Catalyst market organised by GPW and BondSpot and on Treasury BondSpot Poland (TBSP),
- listing, including introduction to trading and listing of financial instruments,
- information services including data from the financial market.
Trading encompasses trade in financial instruments on the Main Market and on GPW regulated markets NewConnect and Catalyst, and on Treasury BondSpot Poland.
Stock market
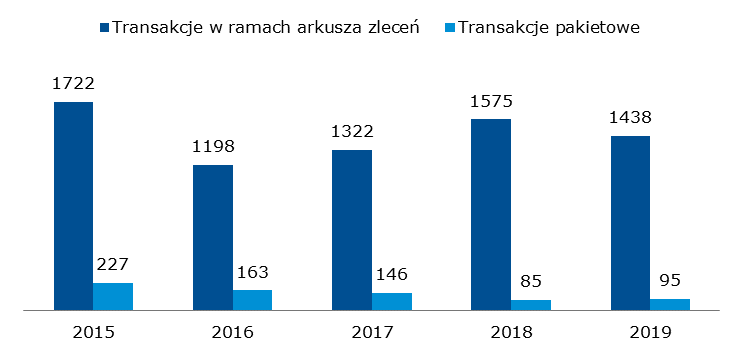
The value of trade in shares on the electronic order book (EOB) on the GPW Main Market was PLN 191.5 billion in 2019, representing a decrease of 6.3% year on year (PLN 204.3 billion in 2018). The average daily value of trade on the was PLN 772 million in 2019, a decrease of 6.7% year on year (PLN 827.0 million in 2018). The number of transactions was 17.9 million in 2019, a decrease of 1.1% year on year (18.1 million in 2018). There were 248 trading sessions in 2019 vs. 247 sessions in 2018.
Value of trade in shares on the Main Market [PLN billion]

The value of trade on the electronic order book on NewConnect decreased by 8.7% year on year to PLN 1,437 million in 2019 and the value of block trades increased by 11.0% year on year to PLN 94.6 million in 2019. The number of transactions on the electronic order book was 817.5 thousand in 2019, an increase of 8.2% year on year.
GPW organised the second edition of the GPW Innovation Day, an investor event where listed companies, including NewConnect companies, meet with individual and institutional investors, on 2 April 2019. GPW organised in 2019 the second and third edition of the Gaming on the Exchange event dedicated to investing in the dynamically growing computer gaming industry. GPW initiated a new conference series, Business in the Genes, exploring the potential of biotechnology companies in 2019. GPW is planning to hold conferences in a similar format dedicated to investment themes in 2020.
NewConnect is actively promoted among companies which could potentially be interested in listing on NewConnect. A dedicated Department of GPW regularly meets with individual companies and takes part in industry and thematic conferences to promote GPW’s alternative market.
Value of trade in shares on NewConnect [PLN million]
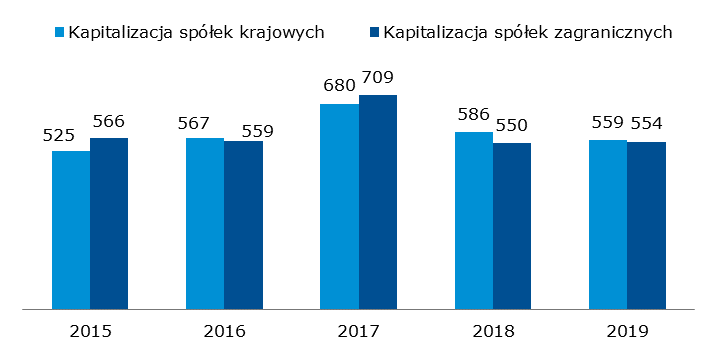
The capitalisation of domestic companies listed on the Main Market was PLN 550 billion at the end of 2019. The capitalisation of foreign companies listed on the Main Market was PLN 554 billion at the end of 2019.
Capitalisation of domestic and foreign companies on the Main Market [PLN billion]

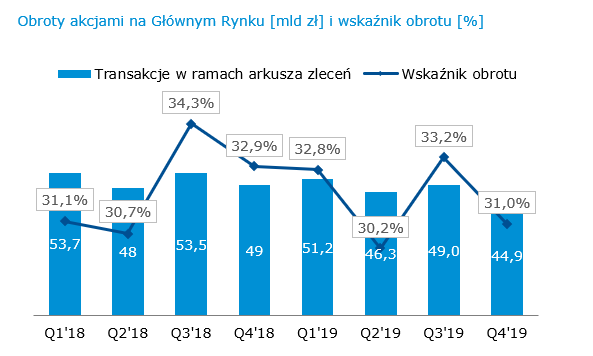
The velocity ratio reached the year’s high of 33.2% in Q3 2019. The annual velocity ratio was 31.8% in 2019 vs. 32.3% in 2018.
Turnover in shares on the Main Market [PLN billion] and velocity [%]
GPW takes far-reaching initiatives to improve liquidity on the Main Market, mainly including acquisition of new clients, improvement of infrastructure and availability, and generation of additional volumes among others through active promotional programmes offering reduced transaction fees.
The colocation service is dedicated to algorithmic traders seeking the closest possible access to GPW markets for themselves and for their clients. GPW attracted one new client in 2019. The colocation service is a key part of the capital market infrastructure which supports the segment of electronic liquidity providers and improves liquidity of the order book.
GPW attracted five new Exchange Members in 2019: Credit Suisse Securities de Valores (Madrid), BofA Securities Europe (Paris), HRTEU Limited (Dublin), Liquidnet EU Limited (Dublin), UBS Europe SE (Frankfurt), Tower Research Capital Europe B.V. (Amsterdam).
The Super Market Maker programme was in effect in 2019. The programme supported liquidity of the cash market and the volume of trade in shares of the biggest companies participating in the WIG20 portfolio. The programme imposed much higher requirements for market makers’ orders on GPW (size, spread) but it also provided eligible participants with reimbursement of part of transaction fees. Similar schemes which encourage market makers to offer better quotes are available for all classes of derivatives.
- High Volume Provider (HVP) programme is addressed to entities which invest on own account only. Launched by GPW in November 2013, it offers promotional fees to those investors who generate at least PLN 5 million of trade in equities per session on the stock market or 150 thousand futures and options on the derivatives market. HVP mini, an additional threshold of minimum trade volumes under the High Volume Provider programme, was introduced in June 2017. The HVP mini thresholds are PLN 2.5 million on the cash market and 75 futures contracts or options on the derivative market. Trade under the HVP programme is aggregated on a monthly basis.
- High Volume Funds (HVF) Programme: the programme is addressed to investment funds which actively trade in shares or derivatives on GPW. It was launched in July 2015. Similar to HVP, it is a fee promotion for those funds which generate daily trade in shares exceeding PLN 5 million or 150 futures and options. The velocity ratio of a fund, calculated as the turnover generated within three months to the fund’s net asset value, should be at least 200 percent per three months.
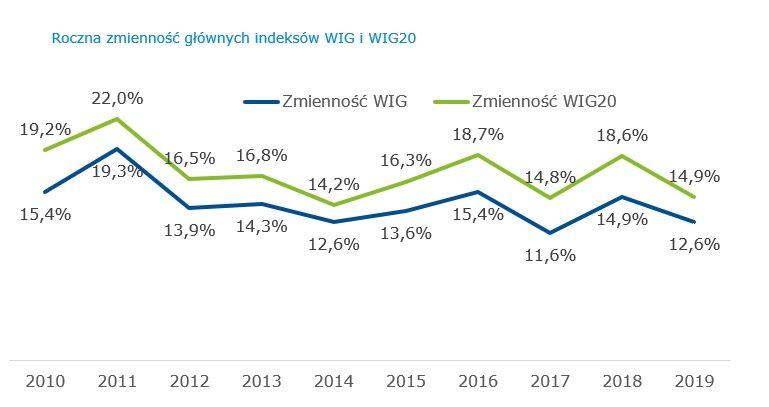
All these initiatives were designed to improve liquidity. However, volatility remains a key parameter impacting investors. After a strong rise in 2018, volatility dropped again in 2019.
Annual volatility of WIG and WIG20
Other cash market instruments
The GPW cash market also lists structured products, investment certificates, warrants and ETFs.
Number of structured products, investment certificates, ETFs and warrants
| as at 31 December (#) | 2019 | 2018 | 2017 | 2016 | 2015 |
|---|---|---|---|---|---|
| Structured products (certificates) | 1,220 | 1,151 | 942 | 784 | 702 |
| Structured products (bonds) | 1 | 0 | 1 | 0 | 0 |
| Investment certificates | 36 | 33 | 36 | 37 | 30 |
| ETFs | 6 | 3 | 3 | 3 | 3 |
| Warrants | 0 | 0 | 0 | 0 | 0 |
In total, GPW listed 1,220 structured products that were investment certificates, 1 structured product based on a bond, 36 investment certificates, and 6 ETFs at the end of 2019, and the total value of trade in those instruments was PLN 1.54 billion in 2019 vs. PLN 1.11 billion in 2018 (+39.4% YoY). Structured products had the biggest share in total trade (85.0%), followed by ETFs (11.3%).
Derivatives market
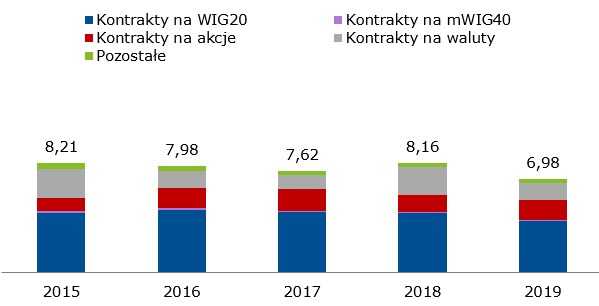
The Warsaw Stock Exchange operates the biggest derivative market in Central and Eastern Europe. WIG20 futures have for years been the most liquid instrument that generates the highest volume of trading on GPW, representing 55.5% of the volume of trade in all derivatives in 2019 (54.5% in 2018, 59.1% in 2017, 58.7% in 2016, 54.1% in 2015, 63.7% in 2014, 65.4% in 2013).
The volume of trade in single-stock futures accounted for 20.7% of the total volume of derivatives trade in 2019 (15.9% in 2018). The share of currency futures in the volume was 19.1% in 2019 (19.1% in 2018).
Structure of volume of trade in derivatives in 2019 by category of instrument

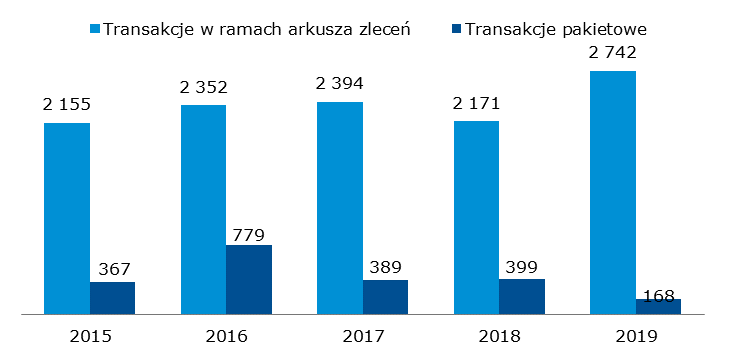
The total volume of trade in derivatives was 6.98 million instruments in 2019, a decrease of 14.5% compared to 8.16 million instruments in 2018. The decrease was mainly driven by a falling volume of trade in WIG20 futures, from 4.45 million in 2018 to 3.88 million in 2019, and a decrease of the volume of trade in currency futures, from 2.04 million to 1.33 million contracts. The number of open interest was 171.2 thousand as at 31 December 2019, an increase of 19.2% year on year (143.6 thousand as at 31 December 2018).
Volume of trade in futures, EOB and block trades [million instruments]
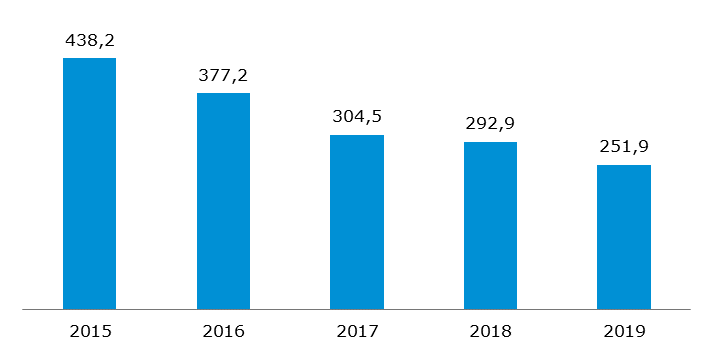
The total volume of trade in options was 251.9 thousand instruments in 2019, a decrease year on year (292.9 thousand in 2018).
Volume of trade in options, EOB and block trades [thousand instruments]
The activity of investors on the derivatives market is largely driven by the volume of trade on the underlying instrument market but it is even more sensitive to volatility than investor activity on the cash market. The volatility of WIG20 on the cash market was lower in 2019 than in previous years and reached 14.9% in 2019 compared to 18.6% in 2018. DLR (derivatives liquidity ratio equal to the nominal value of trade in index derivatives to the value of trade in the underlying) of WIG20 futures was 102 in 2019 compared to 121 in 2018, 112 in 2017, and 110 in 2016.
Similar to the cash market, GPW supports the liquidity of trade in derivatives by offering incentives to providers of liquidity for index futures, single-stock futures, bond futures, and options.
Liquidity on GPW’s financial derivatives market was additionally supported by the HVP and HVF programmes which continued in 2019. The share of programme participants in the volume of trade in derivatives on GPW in 2019 was 10.0% for index futures and 10.5% for single-stock futures vs. 9.2% and 9.3%, respectively, in 2018.
Debt market
The GPW Group offers trade in debt instruments on Catalyst, which is comprised of regulated and alternative trading systems operated on the trading platforms of GPW and BondSpot. The following instruments are traded on Catalyst:
- corporate bonds,
- municipal bonds,
- co-operative bank bonds,
- convertible bonds,
- covered bonds,
- Treasury bonds.
The value of trade in non-Treasury instruments on the electronic order book on the markets operated within Catalyst was PLN 1,725 million in 2019 vs. PLN 1,629 million in 2018 (an increase of 5.9% year on year) and the value of block trades was PLN 119 million in 2019 vs. PLN 337 million in 2018. The total value of trade in non-Treasury and Treasury instruments on Catalyst was PLN 2,912 million in 2019 vs. PLN 2,571 million in 2018, representing an increase of 13.3% year on year.
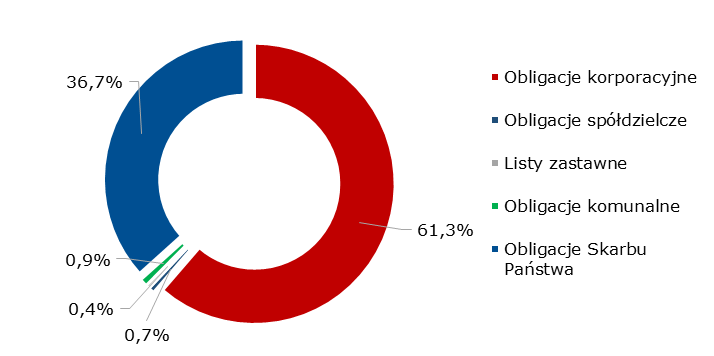
Structure of trade on Catalyst (EOB and block trades) in 2019 by instrument
Value of trade on Catalyst, EOB and block trades [PLN million]
Outstanding non-Treasury bonds to GDP [%]
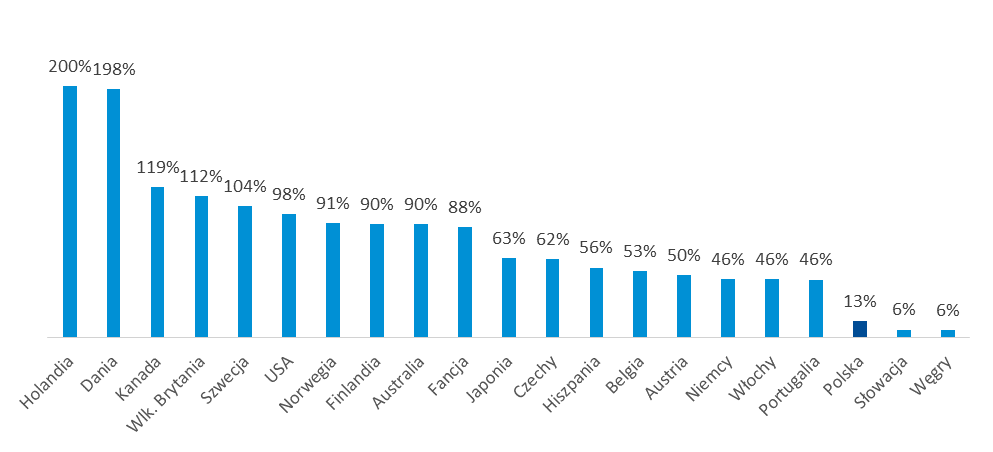
Source: BIS (non-Treasury bonds as at the end of Q2 2019 – most recent available data); IMF (estimated 2019 GDP, based on “Gross domestic product, current prices, USD”)
In 2019, GPW offered a range of initiatives in Poland to introduce companies and local governments to financing options available on all GPW markets. Regional conferences presented ways to raise capital by issuing bonds. Initiatives addressed to local governments included training in bond issues for city treasurers and GPW’s participation in conferences dedicated to the debt market in Poland. GPW participated in the 17th Local Government Capital and Finance Forum in Katowice held on 2-3 October 2019. The event promoted among others local government financing with instruments offered on the markets operated by GPW.
Treasury BondSpot Poland
Treasury BondSpot Poland (TBSP) operated by BondSpot S.A. is an electronic Treasury bond market and an integral part of the Treasury Securities Dealer system operated by the Ministry of Finance with the support of the National Bank of Poland and the banking industry. The main objective of the Treasury Securities Dealer system is to minimise the cost of public debt by improving liquidity, transparency and effectiveness of the Treasury securities market. TBSP includes a market of cash transactions and a market of conditional transactions (repo).
Activity of TBSP market participants was bolstered by measures initiated in previous years and continued in 2019, which ensure optimum solutions for a liquid, safe and transparent market, a broad offer of products addressing the needs of market participants, and competitive costs of market participation.
Activity on TBSP in 2019 was driven mainly by market conditions impacting the local interest rate market, which affected the yields and prices on the local Treasury bond market. Those conditions included the plans of the Polish Monetary Policy Council (RPP) to keep the rates unchanged by the end of 2020 (it was lowered in March 2020), as well as a limited supply of bonds at auctions held by the Ministry of Finance, mainly due to a strong public budget and the achievement of the Ministry of Finance’s 2019 target sales of Treasury securities in 2018.
Trading on the market was also affected by the banking tax, which encourages banks to keep Treasury securities in their assets as such securities reduce the taxable base. As a result, the share of domestic banks among all holders of Treasury securities has increased to the disadvantage of non-residents. The tax affects the activity of banks on the secondary market of conditional transactions (sell/buy back and repo) by curbing the tenors while also directly impairing trading in repos at the end of each month.
As at 31 December 2019, TBSP had 29 market participants (banks, credit institutions, investment firms).
Participation in TBSP changed in 2019 as follows:
- two market participants discontinued their activity:
- Merrill Lynch International stopped operating as a market maker (in August),
- Nest Bank S.A. stopped operating as an institutional investor (in July),
- three entities started operating on the market as market makers (in April):
- Morgan Stanley Europe SE,
- Barclays Bank Ireland PLC,
- BofA Securities Europe SA.
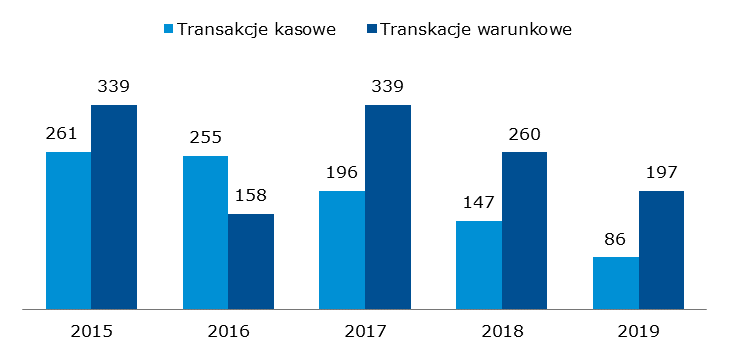
Treasury BondSpot Poland held 248 trading sessions from 1 January to 31 December 2019. The total number of transactions was 7,390. The total value of trade was PLN 282,439.81 million, a decrease of 30.7% year on year. The average value of trade per session was PLN 1,138.87 million. The share of cash transactions and conditional transactions (BuySellBack/SellBuyBack and Repo Classic) in total trade on TBSP was 30.4% (PLN 85,864.16 million) and 69.6% (PLN 196,575.65 million), respectively, in 2019.
Value of trade on Treasury BondSpot Poland [PLN billion]
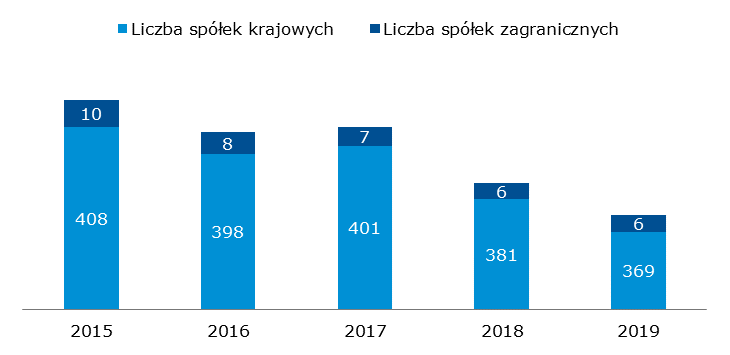
Listing includes admission and introduction to exchange trading and listing of securities on the markets organised and operated by the GPW Group. GPW listed 824 companies at the end of 2019 (449 companies on the Main Market and 375 on NewConnect), including 54 foreign issuers (852 listings including 57 foreign issuers at the end of 2018).
Number of domestic and foreign companies – Main Market

Number of domestic and foreign companies - NewConnect
Change in sector indices in 2019 [%]

The total capitalisation of domestic and foreign companies on GPW’s two equity markets was PLN 1,113 billion at the end of 2019 vs. PLN 1,136 billion at the end of 2018, a decrease of 2.0% year on year. The change in sector indices was different in different sectors. The biggest return rate in 2019 was generated by WIG-IT, WIG-Telecom, and WIG-Real Estate.
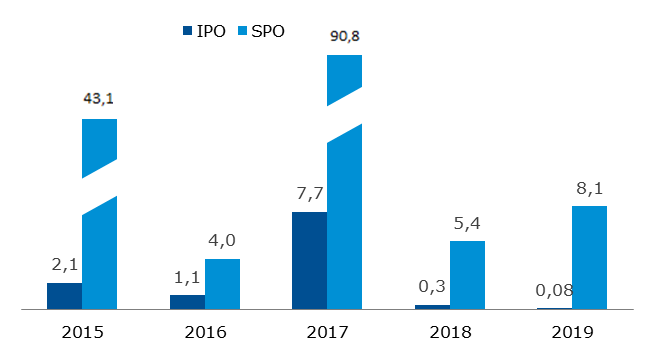
There were 22 new listings on GPW’s two stock markets in 2019 (including 5 companies which transferred from NewConnect to the Main Market) vs. 22 new listings in 2018. The total value of IPOs on the two stock markets was PLN 0.076 billion in 2019 (PLN 0.346 billion in 2018) and the value of SPOs was PLN 8.104 billion in 2019 (PLN 5.356 billion in 2018 and PLN 90.8 billion in 2017: the strong increase in the value of SPOs in 2017 was driven by the SPO of UniCredit S.p.A worth PLN 55.9 billion in Q1 2017).
Capitalisation of domestic and foreign companies – Main Market and NewConnect [PLN billion]
Value of IPOs and SPOs – Main Market and NewConnect [PLN billion]
1Including dual-listed companies
2There were two SPOs of Banco Santander SA worth PLN 33 billion in aggregate in Q1 2015 and an SPO of UniCredit S.p.A worth PLN 55.9 billion in Q1 2017
The nominal value of non-Treasury debt listed on Catalyst was PLN 92.1 billion at the end of 2019, an increase of 6.4% year on year (PLN 86.6 billion at the end of 2018). Catalyst listed 512 series of non-Treasury debt instruments at the end of 2019 vs. 527 in 2018. Issuers whose instruments were listed at the end of 2019 included 27 local governments (vs. 20 in 2018), 99 enterprises (vs. 107 in 2018), and 14 co-operative banks (vs. 16 in 2018). Including the State Treasury, the number of issuers on Catalyst was 145 at the end of 2019 vs. 148 161 at the end of 2018.
GPW collects, processes and sells market data from all of the financial markets operated by the GPW Group. The status of GPW as the original source of information on trading and its strong brand and diversified business activity enable the Company to successfully reach various groups of market participants with advanced information adjusted to individual needs.
Revenue from information services of the parent entity consists of revenue earned on the sale of stock exchange information and data products including: real-time and delayed stock exchange data and statistical and historical data in the form of a statistical e-mail daily bulletin, electronic publications, calculation of indices, other calculations, and index licenses. In addition to data from GPW, TGE, BondSpot and GPW Benchmark, the Company distributed reports of issuers listed on NewConnect and Catalyst to data vendors in 2019.
The sale of information is based on separate agreements signed with exchange data vendors, exchange members, and other organisations, mainly financial institutions. The Group’s revenue from information services also includes the revenue from BondSpot and GPW Benchmark information services.
The key groups of clients who use the GPW Group’s information services include:
Data vendors
Specialised data vendors deliver data made available by the Company to investors and other market participants. Data vendors include information agencies, investment firms, internet portals, IT companies, and other entities with a diversified portfolio of services.
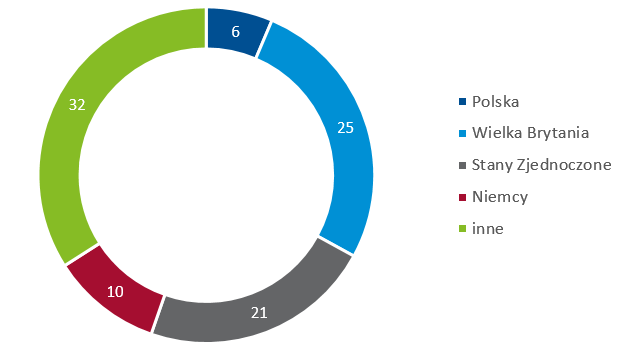
At the end of 2019, GPW had data vendors in Austria, Belgium, the Czech Republic, Denmark, Estonia, France, Germany, Ireland, the Netherlands, Norway, Switzerland, the United Kingdom, the USA.
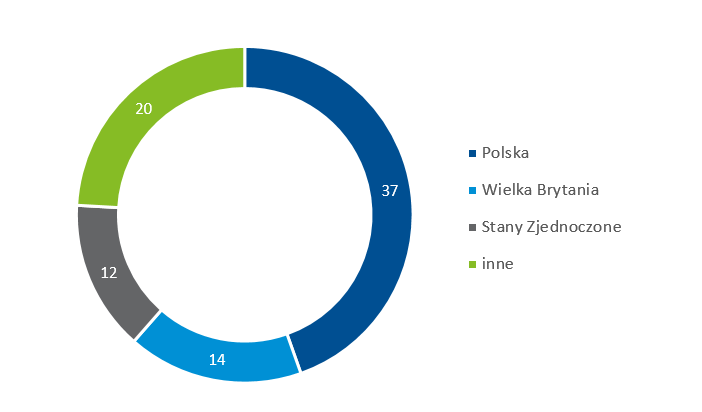
As at 31 December 2019, the GPW Group’s information services clients were 83 data vendors, including 37 domestic and 46 foreign ones, with subscribers using professional and basic data feeds.
GPW Group data vendors [#]
GPW Group data vendors by country [#]
Individual and professional subscribers
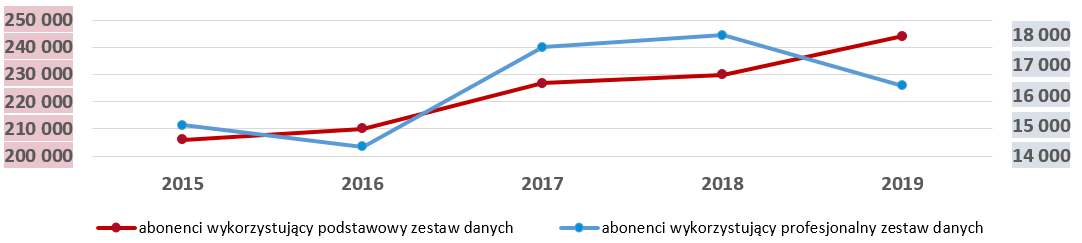
The GPW Group reported an increase of the number of real-time data subscribers who are users of basic data feeds.
GPW Group data subscribers [#]
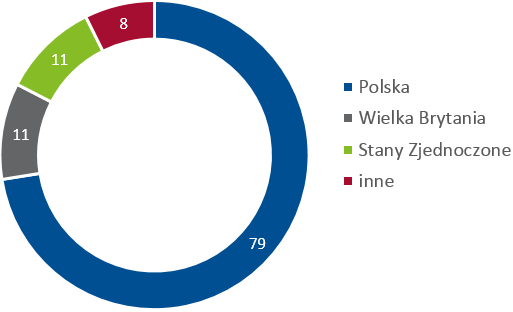
Non-display users of GPW Group data
Following intensive acquisition initiatives, GPW has signed 41 new agreements for selling non-display data (used in algorithmic trading, risk management, portfolio valuation, systematic internalisers, and other non-display applications).
The sale of non-display licences for WIBOR data was a key driver of growth of this business line in 2019.
Non-display users of GPW Group data [#]
Non-display users of GPW Group data by country [#]
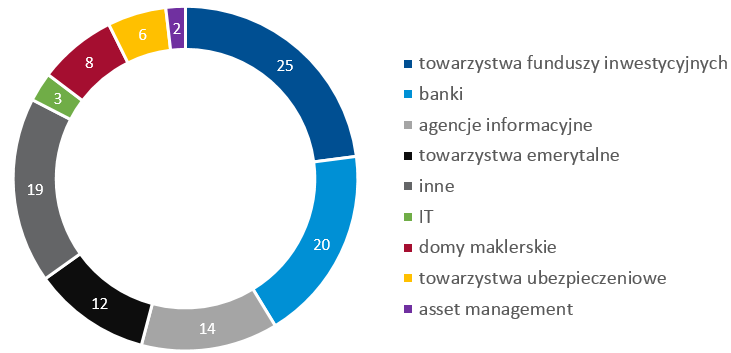
Processed data and benchmarks
In addition to real-time and delayed data, GPW offers a broad range of advanced value-added information products used by financial institutions in analytics. Diverse data and indicators are available in packages addressed to specific segments of the financial market in user-friendly formats.
The main users of processed data and benchmarks in 2019 included investment funds, banks, news agencies, pension funds, brokers and insurers.
Users of processed data and benchmarks [#]
Users of processed data and benchmarks by country [#]
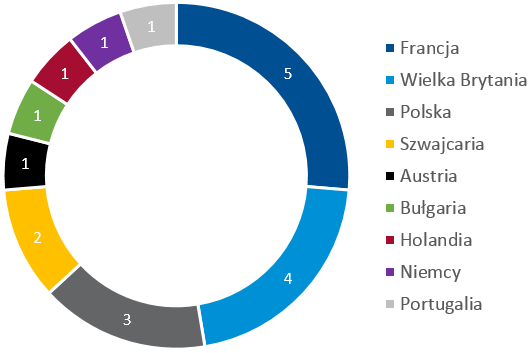
Issuers of financial products – users of GPW indices as the underlying
Index names are registered trademarks. Financial instruments whose name includes an index name require the issuer to sign a licence agreement with GPW.
Two new licence agreements for the use of GPW indices were signed in 2019. The agreement with NN Investment Partners TFI was a milestone: it concerns the use of the new index WIG-ESG in the first passive fund (NN FIO Indeks Odpowiedzialnego Inwestowania) which was newly listed in GPW on 3 September 2019.
GPW signed an agreement with Goldman Sachs concerning the use of WIG20 in certificates.
Issuers of instruments based on GPW indices [#]
Number of data vendors and subscribers, as at 31 December
| 2019 | 2018 | 2017 | 2016 | 2015 | ||
|---|---|---|---|---|---|---|
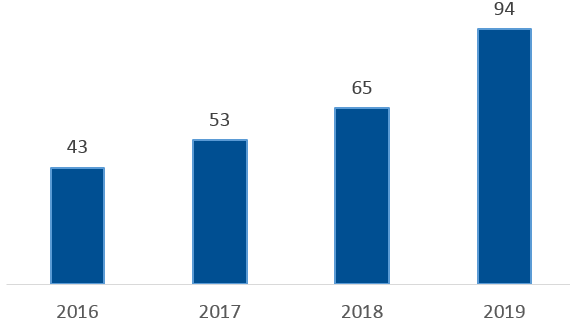
| Number of real-time data vendors | 83 | 78 | 52 | 51 | 54 | |
|
- domestic |
37 | 36 | 27 | 27 | 30 | |
|
- foreign |
46 | 42 | 25 | 24 | 24 | |
| Number of real-time data subscribers [thou.] | 260.3 | 247.9 | 244.4 | 224.4 | 220.9 | |
|
- number of subscribers using professional data feeds |
16.3 | 17.9 | 17.6 | 14.3 | 15 | |
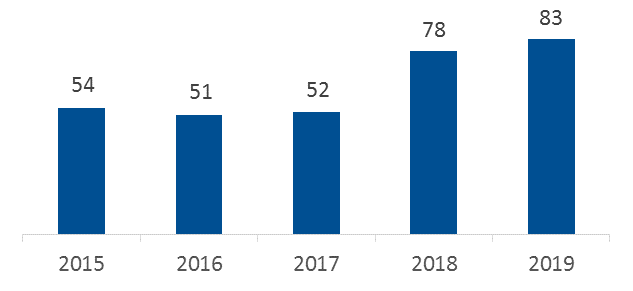
| Number of non-display users of GPW data | 94 | 65 | 53 | 43 | - | |
| Number of licensees using GPW indices as the underlying of financial products | 19 | 17 | 18 | 18 | 18 | |
The Company’s information services also include:
- licences on GPW data for use in the calculation and publication of clients’ proprietary indices and financial instruments;
- licences for television stations using real-time data feeds for limited presentation in public financial programming;
- licences for clearing houses to use GPW Group data.
Commodity market
The activity of the GPW Group on the commodity market is concentrated in the Towarowa Giełda Energii Group which is comprised of TGE, its subsidiary Izba Rozliczeniowa Giełd Towarowych, as well as the OTC platform InfoEngine. The activity of the Towarowa Giełda Energii Group includes:
- operation of a commodity exchange which offers trade in:
- electricity,
- natural gas,
- emission allowances,
- property rights in certificates of origin of electricity, biogas and energy efficiency,
- commodity derivatives settled in cash,
- operation of the Register of Certificates of Origin and the Register of Guarantees of Origin,
- operation of the trade reporting system TGE RRM,
- clearing of transactions on the commodity exchange.
Electricity market
- Day-Ahead and Intra-Day Market
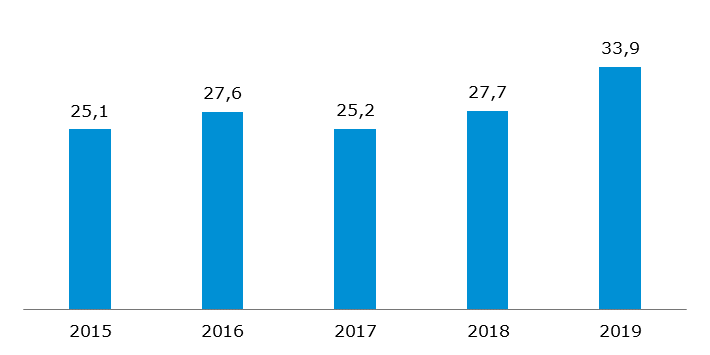
The volume of trade increased by 22.4% year on year in 2019, setting a historical record of 33.9 TWh. It was the first year that the market benefited from recent changes to the mandatory trade scheme. The increase in trade was also driven by TGE’s participation in the international intra-day market, which TGE joined in late November 2019.
Volume of trade in electricity on the Day-Ahead and Intra-Day Market [TWh]
- Commodity Forward Instruments Market in Electricity
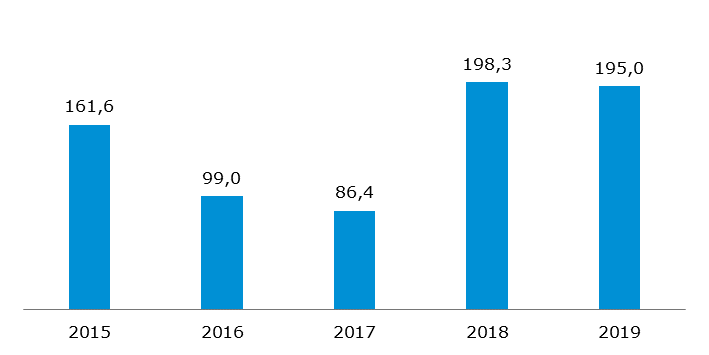
The volume of trade dropped by 1.7% year on year to 195.0 TWh in 2019. Despite the year-on-year decrease, it was TGE’s second-best trading volume ever, generated despite uncertainties concerning compensation for energy traders for keeping mid-2018 retail prices of energy, stabilisation of wholesale prices, and new exclusions from mandatory trade of produced energy on the competitive market.
Volume of trade in electricity on the Commodity Forward Instruments Market [TWh]
Gas market
- Day-Ahead and Intra-Day Market in Gas
- Commodity Forward Instruments Market in Gas
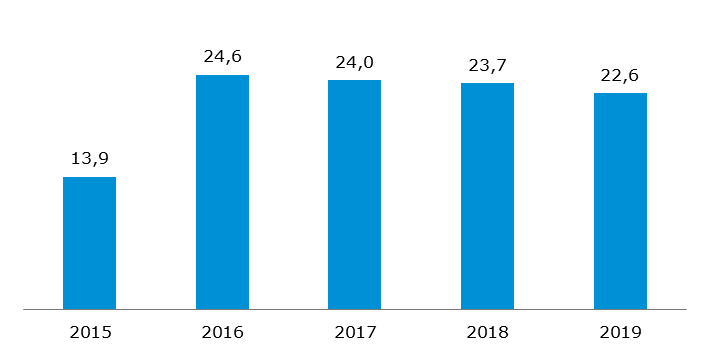
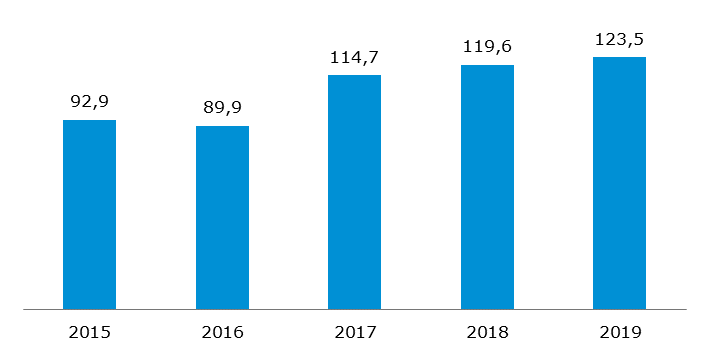
The total volume of trade on the gas markets was 146.1 TWh in 2019, representing an increase of 2.0% year on year and a historical record. The volume of trade on the Day-Ahead and Intra-Day Market in Gas was 22.6 TWh, a decrease of 4.4% year on year. The volume of trade on the Day-Ahead Market in Gas was 16.9 TWh (a decrease of 3.7%) and the volume of trade on the Intra-Day Market in Gas was 5.7 TWh (a decrease of 6.3%). The volume of trade on the Commodity Forward Instruments Market in Gas was record-high at 123.5 TWh, up by 3.2%. The trade was driven by continued year-on-year increase in gas consumption and the gas transmission system input volume in H1 2019. However, the transmission system input volume dropped in Q3. Record-low spot prices did not cause trade to shift to the spot market to a significant extent, and the forward volumes were high.
Volume of trade in natural gas on the Day-Ahead and Intra-Day Market [TWh]
Volume of trade in natural gas on the Commodity Forward Instruments Market [TWh]
Property Rights Market
TGE operates a Property Rights Market in certificates of origin of electricity produced:
- from renewable energy sources (PMOZE and PMOZE_A, known as green certificates),
- in high-efficiency cogeneration (PMGM, known as yellow certificates; PMEC, known as red certificates; and PMMET, known as purple certificates). Note: The scheme expired at the end of June 2019.
Furthermore, the Property Rights Market lists:
- property rights in certificates of origin of biogas (PMBG, known as brown certificates),
- property rights in certificates of origin of agricultural biogas (PMOZE-BIO, known as blue certificates),
- property rights in energy efficiency certificates (PMEF, known as white certificates).
The Property Rights Market is a part of the support scheme for producers of energy from renewable energy sources. It allows producers of energy from renewable energy sources and biogas and holders of energy efficiency certificates to sell property rights, and energy operators required to pay substitution fees or to cancel certificates of origin to meet that obligation.
The volume of trade on the Property Rights Market is driven by the number of certificates issued in the Register of Certificates of Origin: increased production of energy generates the obligation to issue more certificates of origin, which in turn generates an increase of the volume of certificates of origin available on the market.
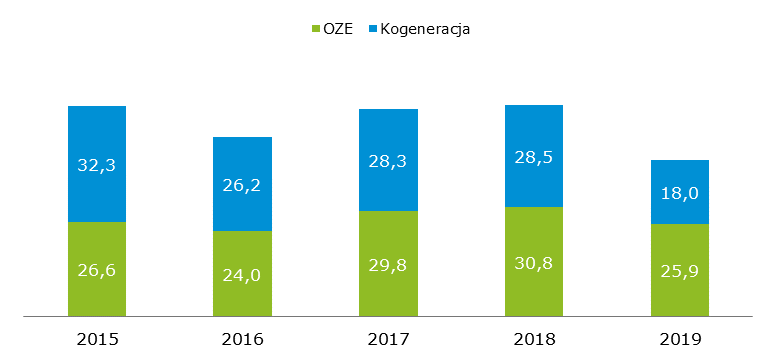
The volume of trading in RES instruments (PMOZE, PMOZE_A and PMOZE-BIO) was 11.7 TWh at sessions and 14.2 TWh off sessions in 2019. Supply dwindled due to stabilisation of prices of green certificates and the phasing out of the support scheme for old RES units (more than 15 years old), affecting the trading volumes of the instrument.
The volume of trade in cogeneration instruments (PMEC, PMGM, PMMET) was 5.2 TWh at sessions and 12.8 TWh off sessions. June 2019 was the last month of the cogeneration support scheme based on energy certificates.
The volume of trade in white certificates (PMEF, PMEF-2018, PMEF-2019, PMEF_F) increased in 2019 to 435.7 ktoe at sessions (up by 52.6%) and 56.5 ktoe off sessions. The volume of trade in energy efficiency certificates was exposed to strong uncertainty in H1 2019 due to late adoption of the Energy Efficiency Act, which extended the PMEF instruments for another two years (until 30 June 2021). PMEF prices per 1 toe dropped from PLN 320 to PLN 25 in H1, boosting speculative trade. As PMEF-2018 is strongly correlated with PMEF, the liquidity of the latter also increased in late June. Following the publication of the Energy Efficiency Act, supply of certificates increased sharply due to the requirement to meet the 2019-2020 obligation, boosting trade volumes significantly. It was also possible to fulfil the obligation for the past three years until 30 June 2019, and many entities did so.
Volume of trade in property rights to certificates of origin [TWh]
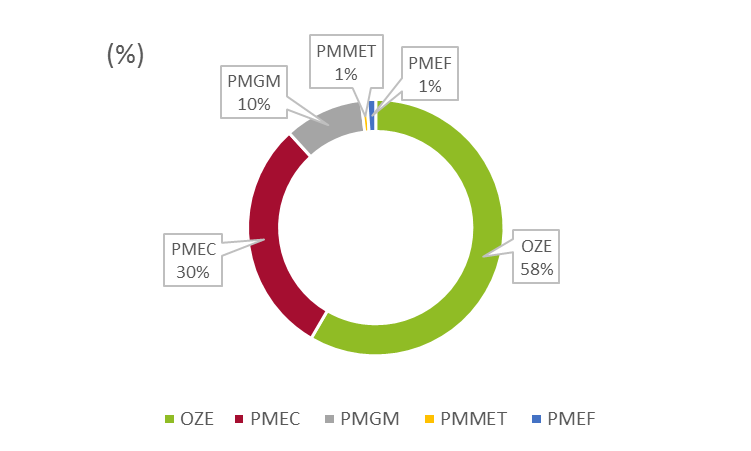
Volume of trade in property rights in 2019 by type of certificate
The Register of Certificates of Origin is a system of registration and recording of:
- certificates of origin which confirm that electricity was generated in high-efficiency cogeneration. Note: this scheme expired at the end of June 2019,
- certificates of origin which confirm that electricity was generated from renewable energy sources (RES),
- certificates of origin which confirm that agricultural biogas was produced and introduced to the gas distribution network,
- energy efficiency certificates which confirm that the project improved energy efficiency,
- property rights under such certificates.
The main functions of the Register of Certificates of Origin include:
- to identify entities entitled to property rights in certificates of origin,
- to identify property rights under certificates of origin and the corresponding quantity of electricity,
- to register certificates of origin and the resulting property rights,
- to record transactions in property rights and balances of property rights in certificates of origin,
- to issue documents confirming property right balances in the register, used by the Energy Regulatory Office for cancellation of certificates of origin.
Certificates issued and cancelled (Register of Certificates of Origin)
RES – Green Certificates
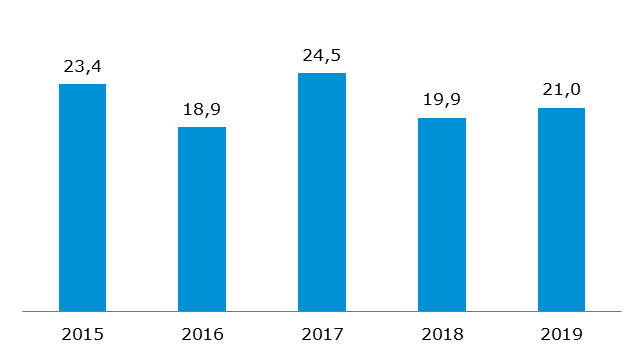
The volume of issued green certificates was 21.0 TWh in 2019, an increase of 5% year on year (19.9 TWh in 2018). The increase in the volume of issued certificates was driven by delayed issuance of certificates by the Energy Regulatory Office.
Volume of issued RES property rights [TWh]
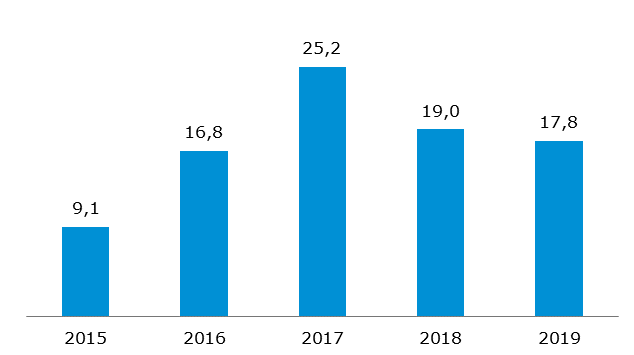
The volume of cancelled green certificates was 17.8 TWh in 2019 vs. 19.0 TWh in 2018. Despite an increased obligation to cancel RES certificates of origin (19% in 2019; 17% in 2018), the volumes of cancelled certificates decreased.
Volume of cancelled RES property rights [TWh]
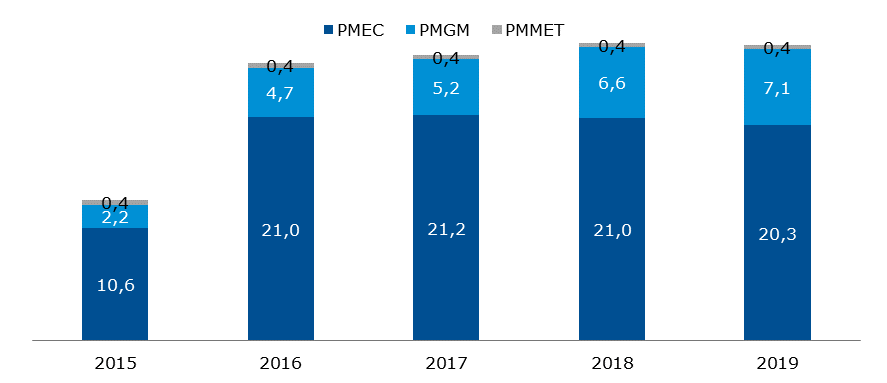
Cogeneration: red, yellow, and purple certificates
The total volume of issued cogeneration certificates was 14.1 TWh in 2019, a decrease of 49% year on year (27.6 TWh in 2018).
Volume of issued cogeneration property rights [TWh]
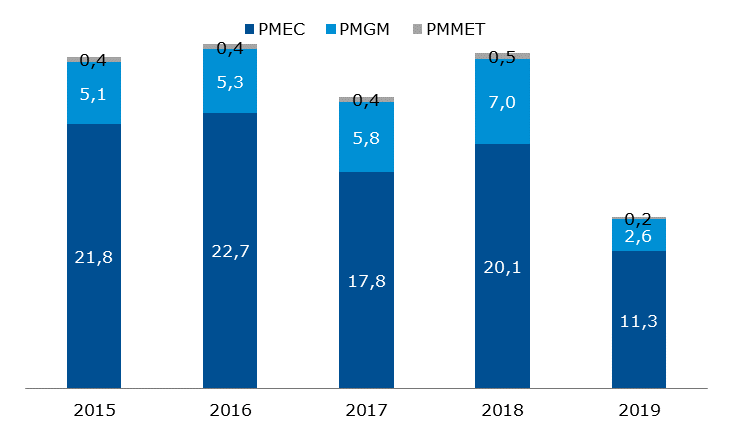
The total volume of cancelled red, yellow, and purple certificates was 27.9 TWh in 2019 vs. 28.0 TWh in 2018, a decrease of 1%.
Volume of cancelled cogeneration certificates of origin [TWh]
Energy efficiency: white certificates
224.1 thousand toe of white certificates were issued in 2019, an increase of 12% year on year compared to 200.6 thousand toe in 2018. The volume of cancelled white certificates was 459.7 thousand toe in 2019 vs. 384.8 thousand toe in 2018, an increase of 19% year on year.
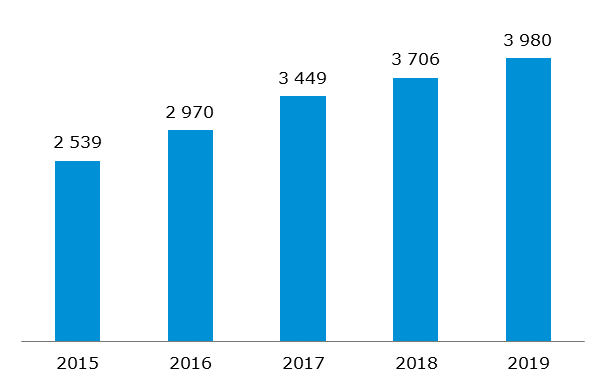
Number of participants of the Register of Certificates of Origin
The Register of Certificates of Origin had 3,980 participants at the end of 2019. In 2019, 274 companies became members of the Register of Certificates of Origin (257 companies in 2018).
A large part of the new members are beneficiaries of white certificates (energy efficiency certificates) following the completion of the fifth tender for energy efficiency projects held by the President of the Energy Regulatory Office. New members also include companies which implement efficiency initiatives.
Number of participants of the TGE Register of Certificates of Origin
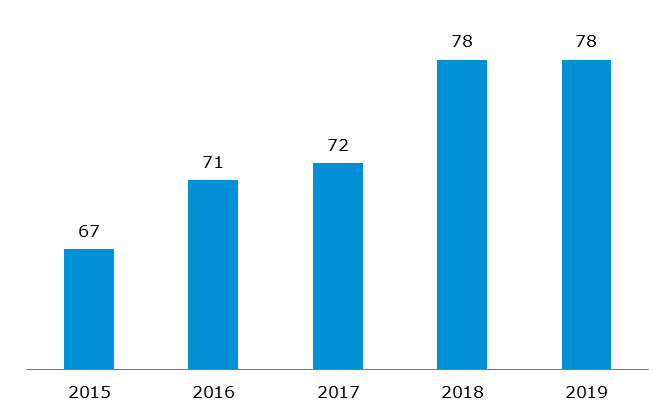
NUMBER OF TGE MEMBERS
Four new companies joined TGE as members in 2019. TGE had 78 members at the end of 2019.
TGE offers regular training programmes and examinations for Exchange Brokers. Participation in training and passing an examination for Exchange Brokers authorises Exchange Members to trade on TGE. In 2019, 50 Exchange Broker certificates were issued, including 11 certificates for Brokers who passed the examination in English. TGE completed 7 training programmes for brokers in 2019.
Number of TGE members
TGE operates a Register of Guarantees of Origin and organises trade in guarantees of origin. The Register of Guarantees of Origin launched in September 2014 and registers energy from renewable sources and OTC trade in environmental benefits of its production. Unlike certificates of origin, guarantees do not involve property rights or a support scheme for renewable energy sources: they are issued for information only. There is no obligation to acquire guarantees but they can be used by entities to prove that a certain quantity of consumed energy was generated from renewable sources. TGE offers trade in guarantees of origin of energy since November 2014.
According to the regulations, the Energy Regulatory Office issues guarantees of origin which are then uploaded to the IT system of the Register of Guarantees of Origin operated by TGE. System users can trade in guarantees of origin or transfer them to end users as proof that energy was generated from renewable sources.
In October 2019, the Register of Guarantees of Origin was extended to include a module of guarantees of origin of high-efficiency cogeneration. 3.4 TWh of cogeneration guarantees were uploaded into the system. The number of applications for participation in the Register of Guarantees of Origin increased sharply in Q4 2019 following the addition of photovoltaic installations developed by auction winners.
The Register of Guarantees of Origin had 619 participants at the end of 2019. 180 members joined in 2019 (107 members joined in 2018).
Register of Guarantees of Origin
| Issued | Sold | Transferred | |
|---|---|---|---|
| TWh | GWh | GWh | |
| 2015 | 7.23 | 635 | 732 |
| 2016 | 12.3 | 591 | 702 |
| 2017 | 12.6 | 2,548 | 2,875 |
| 2018 | 17.0 | 16,848 | 13,645 |
| 2019 | 21.5 | 19,138 | 14,693 |
TRADE REPORTING – TGE RRM
TGE offers a Registered Reporting Mechanism (RRM) to electricity and gas market participants under the requirements of REMIT and its Implementing Regulations, including reporting of trades on organised trading platforms as of 7 October 2015 and OTC trade reporting as of 7 April 2016. All information required under REMIT and Regulation 1348/2014 is reported for the electricity market and the gas market.
Until the end of 2019, there were:
- 29,116,567 reported operations on exchange orders,
- 13,482,463 reported exchange orders,
- 5,807,359 reported exchange transactions,
- 216,832 reported OTC transactions,
- 226,226 exchange reports sent to ARIS,
- 50,719 OTC reports sent to ARIS,
- reporting services for 600 clients - ACER has registered 651 entities, which means that TGE reports for nearly 92% of participants of the Polish energy market,
- 1,767 users have access to TGE RRM.
Information services on the financial market and the commodity market are described in section: Information services on the financial market.
Izba Rozliczeniowa Giełd Towarowych S.A. (IRGiT) offers clearing services on all markets operated by Towarowa Giełda Energii S.A. (TGE). IRGiT is authorised as a clearing house and a settlement institution under the Act on Trading in Financial Instruments and operates as an authorised exchange clearing house under the Commodity Exchange Act.
In 2019, IRGiT provided clearing services as an exchange clearing house (GIR) for the TGE Exchange Commodity Market and as a clearing house and settlement institution for the Financial Instruments Market which reopened in 2019. The total volume of cleared transactions in electricity was 629 TWh, the total volume of cleared transactions in gas was 454 TWh, and the total volume of cleared transactions in property rights was 88 TWh in 2019. IRGiT served nearly 60 direct members and more than 200 entities operating via brokers in 2019.
In 2019, IRGiT continued to pursue its development plans aligned with the TGE Group strategy and the project map for 2018-2020, including initiatives implemented under the Warsaw Stock Exchange strategy.
The key projects pursued in 2019 included the development of a model for securing and clearing transactions in the common European electricity market mechanism (Intra-Day Market XBID); preparations for the launch of an Agricultural and Food Commodity Market; and development of the risk management system.
In November 2019, IRGiT started to clear the XBID Intra-Day Market operated by TGE. In this project, IRGiT developed a model for securing, clearing and financial settlement of transactions on the market trading 24/7 in EUR.
In the development of the Agricultural and Food Commodity Market, IRGiT developed a model for securing, clearing and financial settlement of transactions on the market in the single-price system and at auctions.
In the improvement and optimisation of the collateral system in 2019, new rules for offsetting of initial deposits and additional margins were developed for members of energy groups. The new model offers netting of initial margins and provides up to 80% reductions of margins within energy groups. In the improvement and optimisation of the risk management system in 2019, IRGiT was working to optimise the costs of exchange trade and improve safety of market participants.
In 2019, IRGiT continued to pursue its policy of active education of market members concerning risk management and the collateral and clearing system organised by IRGiT. The IRGiT Risk Committee met four times in 2019. It is IRGiT’s advisory body in matters of regulation and arrangements concerning risk management in IRGiT’s clearing services. IRGiT representatives participated in meetings of the Electricity and Gas Market Committee held by TGE; meetings with the Association of Energy Trading in the framework of the Collateral System Optimisation Group; and industry events such as the Energy Fair and Montel Market Insights. IRGiT representatives took part in plenary sessions, calls, and other work of the Policy Committee, the Risk Committee, and the Legal Committee of the European Association of CCP Clearing Houses (EACH).
In 2019, IRGiT established relations with the Baltic-Finnish gas exchange GET Baltic. IRGiT provides advisory services in the development of a risk management system and a collateral and clearing model for the gas exchange operated by GET Baltic for Lithuania, Latvia, Estonia, and Finland.
