External environment
Market environment
Continued globalisation and competition
Competition of financial instrument trading venues in Europe has largely increased over the past few years following the implementation of EU Directives MiFID I and MiFID II. Operators of regulated markets compete for new issuers, investors, liquidity and trade. Another challenge for exchanges is posed by OTC (Over The Counter) markets, MTFs (Multilateral Trading Facilities) and SIs (Systematic Internalisers), supported by MiFID I and MiFID II.
Some MTFs have been licensed as regulated markets, for instance CBOE Europe Equities, the third biggest stock trading venue in Europe in 2019. The experience of other exchanges suggests that the emergence of alternative trading venues boosts the total turnover in stocks on the market due to the emergence of new investor categories as well as arbitrage strategies pursued by market participants who trade in the same stocks on two or more venues. However, the percentage share of incumbent exchanges in total trading typically shrinks. Trading in Polish equities has been offered for several years by the London-based venue Turquoise (owned by the London Stock Exchange) and, since 5 November 2018, by CBOE Europe Equities. Polish stocks were traded on certain trading days on both of these venues in 2019 but their share in total trade was negligible. In the opinion of GPW, this could suggest that smaller markets, such as GPW, tend to concentrate trading. Alternative trading venues which offer trade in Polish stocks charge significantly lower execution fees but their costs of clearing and settlement are much less competitive.
Implications for GPW
In response to potential emergence of threats from competitive trading venues, GPW has been focusing on improvement of stock market liquidity and order book quality. GPW has offered promotions to electronic traders (HVP, HVF) as well as programmes for market makers. GPW has added and improved system functionalities which address the needs of those market participants who trade in large volumes. Launched in Q1 2016, the colocation service is another key part of the capital market infrastructure which supports the development of electronic liquidity providers and largely improves liquidity of the order book. GPW launched its Technology Development Support Programme in March 2019. Developed in consultation with brokers, the Programme offers discounts on some exchange fees to those brokers who invest in additional technological potential and improve the quality of service. GPW launched a pilot Analytical Coverage Support Programme in 2019 (see section 4.3.4 for details). To make trade on the exchange even more attractive, GPW is expecting to benefit from the new Employee Capital Plan (PKK) programme combined with initiatives under the Government’s Capital Market Development Strategy (SRRK). Following the promotion of Poland to Developed Markets by FTSE Russell and Stoxx, GPW actively promotes the Polish stock market among global investors in partnership with local brokers.
Equity trading on European FESE exchanges and alternative trading venues1 [EUR bn]

Source: FESE – European Equity Market Report; *CBOE Europe Equities is a regulated market according to FESE classification. For comparison, it is shown under MTFs
According to FESE data, MTFs (Turquoise, Aquis Exchange) and CBOE Europe Equities (originally an MTF, now classified as a regulated market by FESE; for the purposes of this analysis, it is considered an MTF) generated EUR 2.3 trillion i.e. 24.9% of European stock trade on the electronic order book in 2019. The total value of European stock trade on the electronic order book (exchanges and MTFs) stood at EUR 9.4 trillion in 2019, down by EUR 1.8 trillion or 16.1% year on year.
Number of listed companies
According to FESE and WFE, all European exchanges listed 9,569 domestic companies at the end of 2019. The Spanish exchange BME had the biggest number of listings (2,870 companies) accounting for more than 30.0% of all European listings. GPW ranked fifth with 798 domestic companies representing 8.3% of the total number of domestic companies listed on European exchanges.
There were 7 IPOs on the GPW main market and 15 IPOs on the alternative market NewConnect in 2019.
Implications for GPW
GPW has launched one of the #GPW2022 strategic initiatives: GPW Growth, a programme of support for the development and transition of SMEs. Accordind to PwC data (IPO Watch) in total, there were 106 IPOs across European exchanges in 2019, 47% down on the prior year.
Number of domestic companies listed on European exchanges in 2019

Source: FESE; WFE - https://focus.world-exchanges.org/issue/january-2020/market-statistics
Capitalisation of stock markets
According to WFE, the total capitalisation of all exchanges globally in 2019 increased by 26.6% to USD 94.3 trillion at the year’s end (source: WFE). The biggest global exchange was NYSE with a capitalisation of domestic companies at USD 24.0 trillion at the end of 2019, followed by NASDAQ with a capitalisation of USD 13.0 trillion, Japan Stock Exchange – USD 6.2 trillion, Shanghai Stock Exchange – USD 5.1 trillion, Hong Kong Stock Exchange – USD 4.9 trillion, Euronext – USD 4.7 trillion, London Stock Exchange – USD 4.2 trillion, and Deutsche Boerse – USD 2.0 trillion.
Implications for GPW
The biggest exchange in Europe is the Euronext Group (EUR 4,194 billion) followed by the LSE Group (EUR 3,732 billion) and Deutsche Boerse (EUR 1,777 billion). With a capitalisation of EUR 135 billion, GPW ranks eighth in Europe and it is by far the biggest market in CEE.
Capitalisation of domestic companies on European exchanges in 2019 [EUR billion]
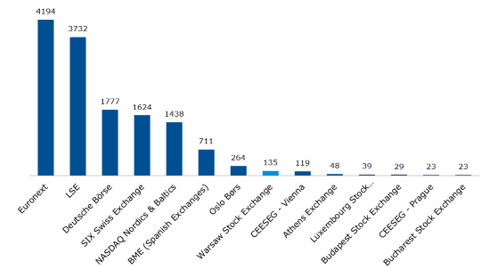
Source: FESE, (monthly statistics, December 2019); LSE Group data based on WFE statistics and converted from USD to EUR
Change in capitalisation of domestic companies on European exchanges in 2019 [% change in EUR]
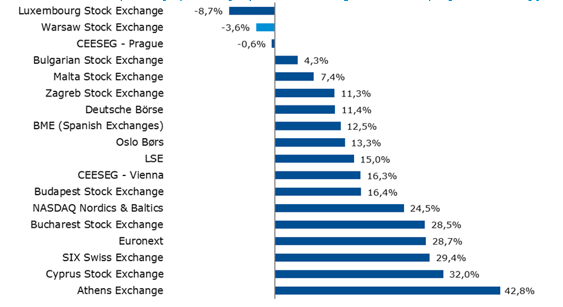
Source: FESE (monthly statistics, December 2019); LSE Group and Deutsche Borse data based on WFE statistics
Equity trade
According to FESE’s European Equity Market Report, the European exchange industry is dominated by several large operators. As measured by the volume of trade in stocks on the electronic order book in 2019, the European leader was the London Stock Exchange Group with EUR 1.78 trillion (the group includes the London Stock Exchange and Borsa Italiana in Milan) followed by the Euronext group with EUR 1.71 trillion (the group operates regulated markets in Belgium, France, Ireland, the Netherlands, Portugal and the UK), CBOE Europe Equities with EUR 1.67 trillion, and Deutsche Boerse with EUR 1.34 trillion.
Implications for GPW
According to FESE statistics, the value of trade in stocks on the electronic order book on GPW was EUR 44.9 billion in 2019, equal to a market share of approximately 0.48% in the European market. GPW remained a strong CEE leader by the value of trade in shares in 2019, ahead of CEESEG Vienna.
Value of trade in shares on the electronic order book on European exchanges in 2019 [EUR billion]
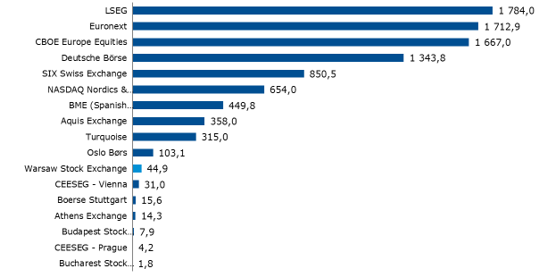
Source: FESE (monthly statistics, December 2019)
Change in the value of trade in shares on the electronic order book on European exchanges in 2019 [% change in EUR]
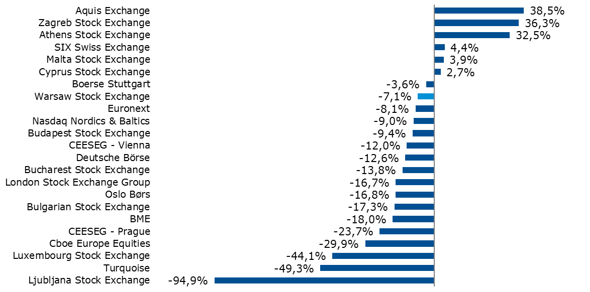
Source: FESE (monthly statistics)
Velocity ratio
Velocity measured as turnover to average monthly capitalisation on European exchanges was 30.4% in 2019 (based on FESE data). The highest velocity ratio was reported by Deutsche Borse, BME, SIX, and the London Stock Exchange Group.
Implications for GPW
GPW’s velocity ratio was 33.6% in 2019 vs. 34.4% in 2018.
Velocity2 on European exchanges in 2019
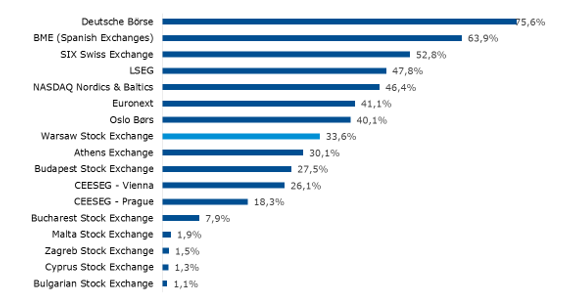
Source: FESE and for LSEG https://www.londonstockexchange.com/statistics/monthly-market-report/lseg-monthly-market-report-december-2019.pdf
GPW’s share in the capitalisation of domestic companies on European exchanges was 1.07% in 2016, 1.24% in 2017, 1.19% in 2018, and 0.95% in 2019.
Electricity and gas market
- Poland is the EU’s fifth and the CEE’s first biggest electricity consumer. International connections with the biggest European electricity market (Germany), the highly liquid Nordic market, the Lithuanian, Czech and Slovak markets, as well as the big Ukrainian market position Poland as a key member of the region and make Towarowa Giełda Energii a strategic partner. TGE plays a key role in generating trade in electricity. The Polish market is distinctive due to a high share of forward trade, which remained strong in 2019. Combined with a strong increase in spot transactions, the annual electricity turnover hit new highs. The turnover volume on the Polish exchange represented 135% of the total electricity volume supplied into the grid in 2019, which puts Poland on a par with the most developed EU member states and exceeds by far the liquidity of many other exchanges of the region. Towarowa Giełda Energii has become a well-established partner on the European electricity market. For more than a year now, all transactions have been made on the regulated market, which in Poland is within the exclusive remit of TGE. Thus, the legislator decided to create a very competitive market ensuring equal access for all participants. The position of TGE on the electricity market has been growing stronger over the years and the turnover reached all-time highs in 2019. Our Members purchased more than 229 TWh of electricity for Western European market areas; the share of spot transactions in the total exchange turnover dropped to 15.5%.
- Similar to electricity, the Polish natural gas market is among the biggest markets in the European Union. The domestic consumption volume ranks Poland Europe’s sixth biggest player. Poland’s dependence on imports is low compared to most EU member states while recent and upcoming investments ensure diversification of the sources of gas imports. The Polish natural gas market is connected to pipelines in Germany, the Czech Republic, Belarus, and Ukraine. That list should in fact include all countries with access to LNG infrastructure. The LNG terminal in Świnoujście is the window to the world of the Polish gas system. European gas markets have different specificities. Poland has a relatively small spot market while trade concentrates on the forward market. As a result, forward transactions in gas exceed the volumes reported in Germany or France. The Netherlands has historically boasted the highest turnover. Members of Towarowa Giełda Energii have traded in gas on the spot and forward market for six years now. With active participation in market liberalisation, continued expansion of the product offer, and earned confidence, Poland has developed the biggest gas trading platform in the region. TGE’s gas market is young compared to its electricity market. Turnover volumes in 2012 and 2013 were very low. Starting in 2014, turnover exceeded 50% of domestic gas consumption. Similar to electricity, the gas market broke new records in 2019 and reported turnover at 146 TWh.
Volume of trade in electricity and gas in European hubs
Volume of trade in electricity on European exchanges in 2019 (spot) [TWh]
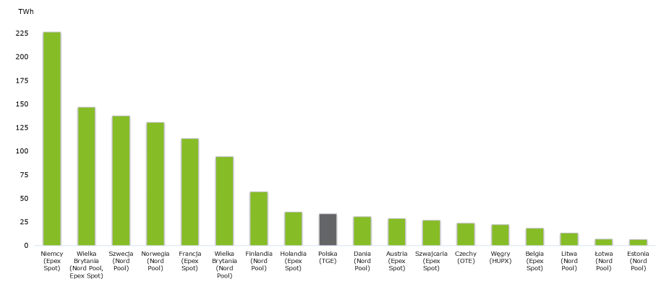
Source: TGE based on exchange data
Volume of trade in electricity on European exchanges in 2019 (forward) [TWh]
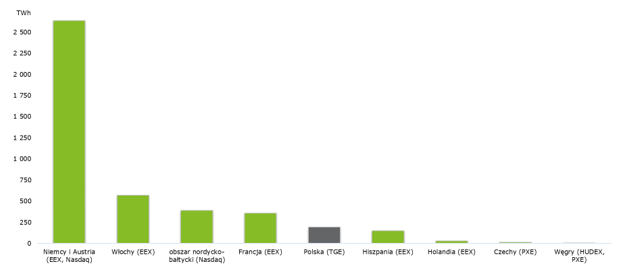
Source: TGE based on exchange data, estimates for EEX
Volume of trade on European gas exchanges in 2019 (spot) [TWh]

Source: TGE based on exchange data
Volume of trade on European gas exchanges in 2019 (forward) [TWh]
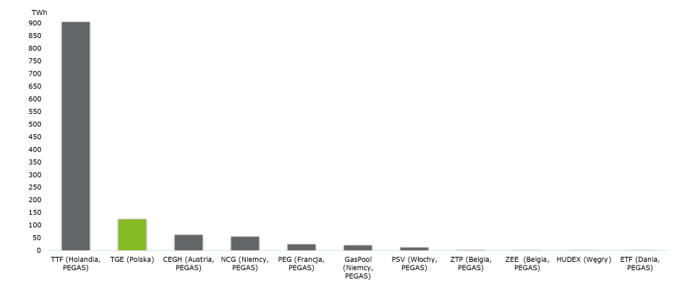
Source: TGE based on exchange data
